
EUROSTAT started with a familiar problem: there is plenty of EuroLeague data, but very little of it arrives in a form that helps you understand a player quickly.
A box score tells you what happened. A season average compresses months into one number. A market line gives you another number, but without context it says almost nothing about the path that produced it.
I wanted to put those pieces on the same screen.
EUROSTAT is a EuroLeague analytics product built around player form. It shows recent performances, the next opponent, an expected value derived from the latest sample, and the available line when the external feed has published one. The purpose is not to hide uncertainty behind a confident label. It is to make the gap between recent form and the current line visible enough to investigate.
A Statistics Product, Not a Scoreboard
The product is intentionally narrow. It focuses on four categories: points, rebounds, assists, and PRA.
For each category, the user can move from the full player list to an individual player page, inspect the recent sample, read the trend on a chart, and compare the form-based expectation with the line for the next game. Search, team filters, and sorting by deviation make a large player pool usable without turning the interface into a dense trading terminal.
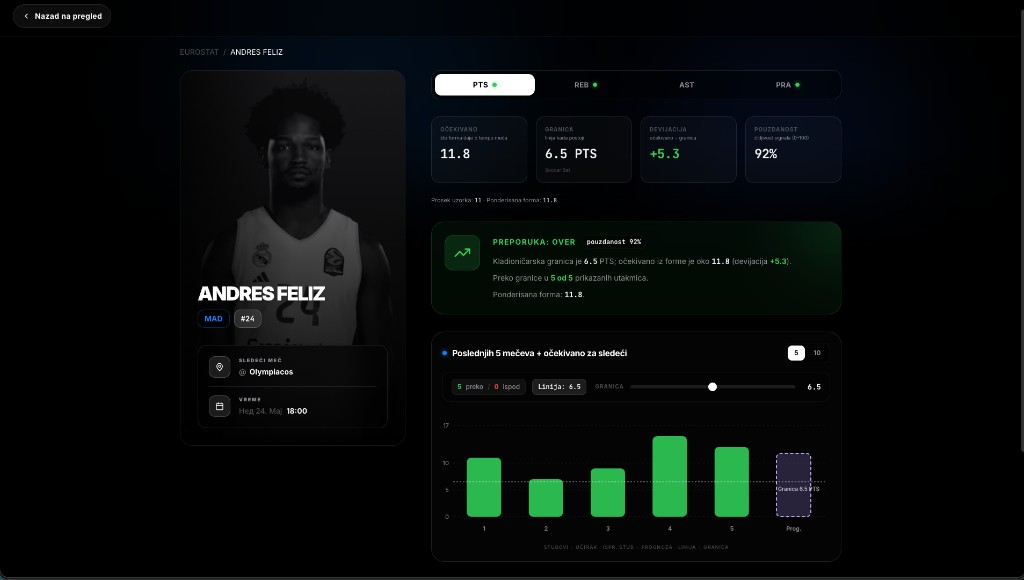
The key number is expected from form.
It is calculated from a weighted sample of recent games, with newer performances carrying more influence. When the data is available, a small pace adjustment can be applied to points or PRA. That result is then placed next to the published line. The difference is an analytical signal, not a promise.
That distinction shaped the language across the product. EUROSTAT does not present a number as certainty. When the line has not been published, it says so. When there is no next game, the comparison disappears. When the difference is too small to be meaningful, the interface can pass instead of forcing a dramatic conclusion.
Turning Several Feeds Into One View
The clean interface sits on top of a less clean data problem.
Official EuroLeague sources provide schedules, game headers, box scores, player statistics, team data, headshots, and crests. A separate external feed provides available lines. Those systems do not share one perfect identifier model, update at the same time, or always describe teams and players in exactly the same way.
The backend therefore has to do more than fetch JSON. It normalizes names and team codes, matches upcoming games within strict time windows, rejects lines that cannot be attached safely, detects completed games, and updates the player history without duplicating records.
A protected daily sync performs that work. It pulls scheduled games, finalizes games when the official box score becomes available, updates recent player samples, refreshes available lines, and persists the result in Supabase.
The data is stored in two complementary forms:
- a compact JSON snapshot for fast server rendering;
- a relational history of teams, players, games, and player-game statistics.
The snapshot keeps the public experience fast. The relational layer keeps the underlying history queryable and gives the product room to become more analytical over time.
The Hard Part Is Trust
The biggest product risk was not visual. It was matching the wrong line to the wrong game.
Teams appear under different names across sources. Schedules move. External feeds can arrive late or carry data from another competition involving the same club. A loose match can create a polished interface with a completely false comparison.
That is why the pipeline is deliberately conservative. EUROSTAT filters for EuroLeague events, checks team identity, requires kickoff times to align within a defined window, and avoids carrying a line forward when the game relationship is no longer reliable.
Missing data is better than misleading data.
The same principle applies to the model. Recent form is useful because it captures what a season average can hide: role changes, minutes, momentum, and short-term variation. It is also limited. It does not know every tactical decision, injury, rotation change, or matchup detail. EUROSTAT makes one layer of evidence easier to read; it does not pretend that one layer is the whole game.
Designing for Fast Comparison
Visually, the product needed to feel closer to a live sports instrument than a traditional statistics database.
The homepage leads with the largest deviations, then opens into a filterable grid of players. Color and labels make over, under, and pass states readable at a glance, while the actual values remain visible beside the signal. Player pages slow the experience down: recent games, charted form, next opponent, sample averages, and the same comparison in more context.
The design rule was simple: show the evidence before the interpretation.
That keeps the interface useful for different kinds of readers. Someone can scan the strongest differences in seconds, while another person can open the player page and decide whether the sample tells a convincing story.
From Prototype to Live System
EUROSTAT is now live at eurostat.rs, with the full implementation available in the public GitHub repository.
The repository includes the Next.js application, the prediction and sampling logic, the EuroLeague ingest pipeline, protected cron routes, Supabase migrations, media synchronization, historical backfill, SEO routes, and the documentation needed to understand how the system moves from an official game feed to a player card.
What began as a way to compare two numbers became a full data product: ingestion, normalization, modeling, storage, interface design, and the discipline to say when the data is not strong enough.
That is the part of EUROSTAT I value most. It does not try to make sport predictable. It makes the available evidence easier to see.
EUROSTAT is part of the UNMARKOBLE creative technology portfolio by Marko Andrić, alongside the PISTA product case study.